Weather BandTurning weather data into musical performances.
Here's a video of our performance during the Network Music Festival in 2020.
ConceptWeather band is a collaborative effort at ITP focused on translating weather data into musical performances. We built digital and physical instruments which play based on weather data drawn from our personal weather station on New York's Lower East Side. My instrument translated temperature data points into a violin's octave. I also worked on the UI for the weather band's data visualization. Most recently, weather band performed for the Network Music Festival online.
Tools
- JavaScript
- p5 creative coding framework
- A weather station!
MechanismsMy code draws temperature data over a range of seven days from an API set up to connect to a weather station on one of the collaborators' roofs in the Lower East Side. The data is mapped into five sections in my UI, which together represent an octave in a violin. The musician can click the data points to add notes of that octave into the composition, so that the weather dictates the affordances the musician has, so to speak, when playing.
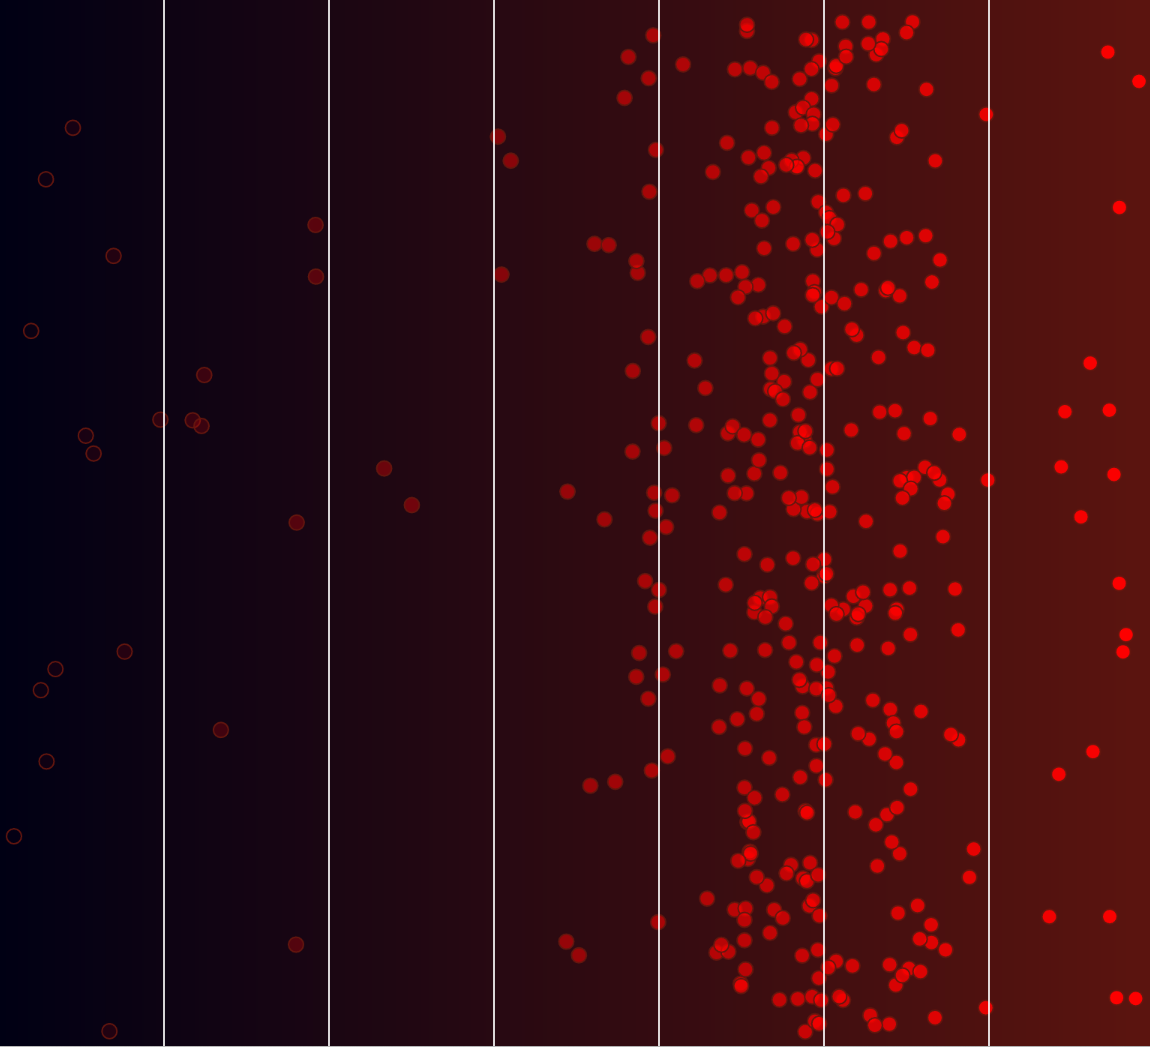
The instrument is separated into an octave, with dots representing individual points of weather data.
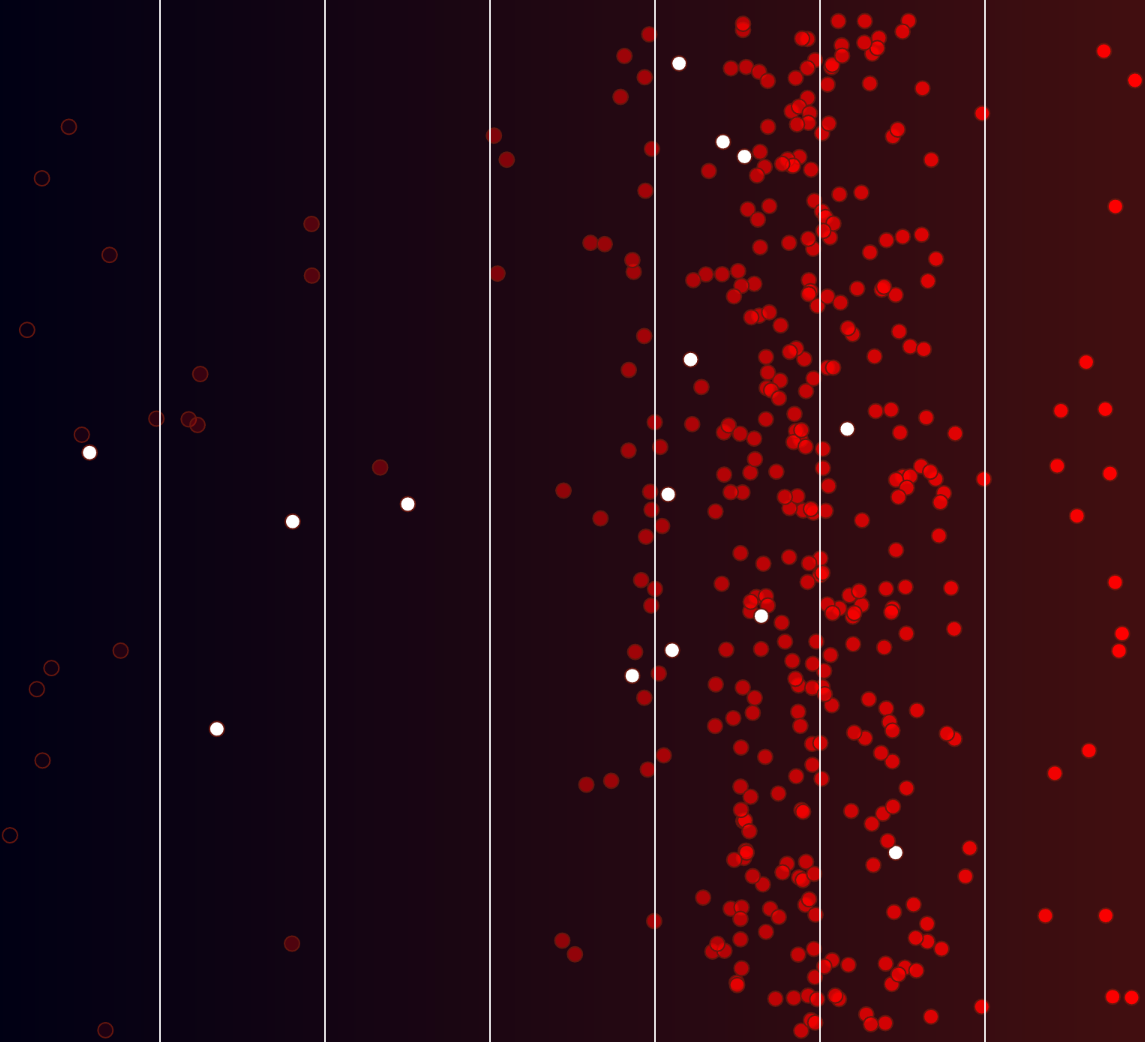
When each dot is clicked, it plays notes from that octave. In this way, the 'performance' is constrained by the weather data.
ReflectionsI love the idea of using environmental data as constraints in producing art. In addition to the temperature, you can also grab other data points like humidity from the weather station. I'd love to experiment in some sort of 3D landscape where you can explore multiple data points in future performances!